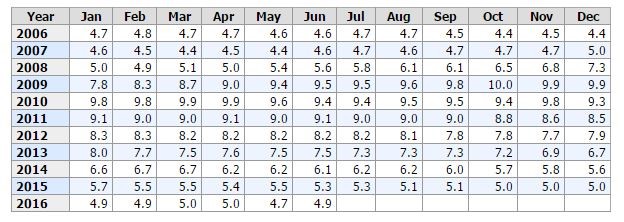
The U-3 unemployment rate for the month of June has hit an 8 year low at 4.9%. Based on this data alone many Americans see this as progress with the job market improving and giving more people an opportunity to work. The “official unemployment rate” (U-3) according to the Bureau of Labor and Statistics, is only one of six unemployment rates that is calculated. Which only includes a certain criteria of unemployed people. When you add all forms of unemployment according to the government the rate increases from 4.9% to 9.6%. Shouldn’t our focus be on total unemployment in America and not just those who fit a certain criteria?

The U-3 unemployment rate omits three unemployment rate categories that represents America’s workers. The U-4 rate combines the U-3 rate with workers who have actively looked for employment in the past 12 months, but have since been discouraged and stopped looking in the last four weeks because they don’t believe there is a full time work available. The U-5 rate adds the U-3 and U-4 rates while including those who are able to work full time who are not discouraged, but have not looked in the last four months for other reasons. The U-6 rate combines all unemployment rates and those who can only work part time because full time employment is not available. The U-3 unemployment rate was at its lowest in June for the first time in 8 years at 4.9%, but the U-6 rate who many see as the true unemployment rate was still high at 9.6%. Americans wanting to work are becoming discouraged by the tough job market.
The chart below shows all 6 employment rates status since 1994. Even though every rate is dropping it is easy to see the difference between the different rates, the U-3 and U-6 in particular. Focusing on the U-3 unemployment rate is a misleading tactic that makes the numbers look better than they are. The U-3 rate focuses on a criteria of the unemployed that does not accurately represent the full present state of unemployment in America. The U-3 unemployment rate does not include the total 94.5 Million Americans who are not in the labor force, it ignores the 1.9 Million Americans who have been unemployed for over 27 weeks and it fails to recognize the 5.8 Million who only work part time because of economic reasons. If the U-3 rate omits so many Americans looking for work, then why is it the official unemployment rate?

The unemployment rate is not the only data taken into account in order to measure unemployment. The participation rate includes the percentage of Americans 16 and over who are either employed or actively looking for work. The chart below shows that for the last two years it has stayed steady at around 62.7%. While this may give us some insight on how many people in the United States are unemployed and looking for work, the participation rate does not include adults 65 and over in their data. Making for a percentage that could be skewed by including about 4 million people retiring every year. If the amount of Americans retiring over shadows the amount of Americans entering the workplace this could effectively decrease the participation rate automatically. The participation rate also omits those who have stopped actively searching for a job.

It is clear that unemployment in America is not a simple as either being employed or unemployed. Yet, our official unemployment rate focuses on a smaller criteria then the other rates we observe. Are we doing this so that the numbers look better than they did 8 years ago? With so many Americans looking for jobs our focus should be on the total unemployment rate and not just those who fit the U-3 criteria.


